Trend Report
Target Audience: Administrators and Teacher (Buzz)

Trend Report Overview
Accelerate Reports are housed on a protected server outside of the Buzz platform. They are accessed through a secure single sign-on (SSO) integration, ensuring users only see data appropriate to their role and student associations.
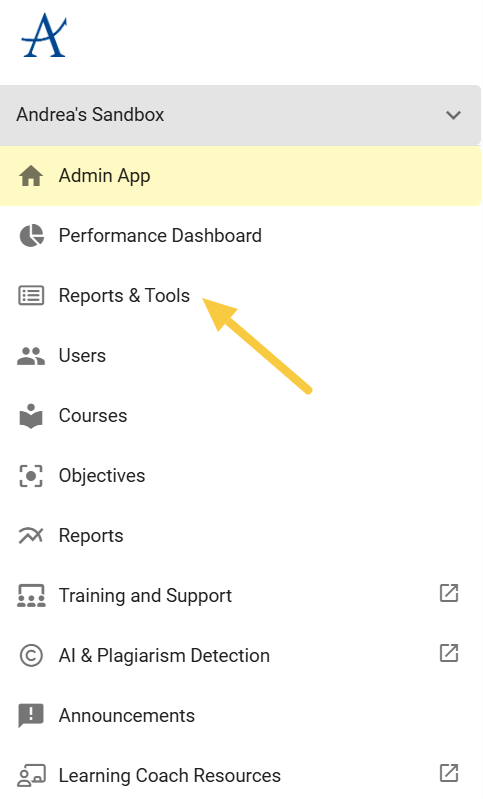
Both teachers and administrators can access the Trend Report by logging into Buzz and selecting Reports and Tools from the main menu. From there, choose Trend.
About the Trend Report
The Trend Report is most effective when used regularly (weekly or biweekly) to monitor students working to get back on pace.
- Displays data for active students within a selected date range
- Provides a daily snapshot (updated at 9 PM GMT; not real-time)
- Includes completion data based on graded activities only
Filter Options
Use filters to refine your report results:
- Filter by school, student, observer, or teacher
- Select a start and end date (recommended range: one week or less)
- Choose between:
- Summary View (default)
- Detailed View
- Download CSV
Once selections are complete, click Update Data.
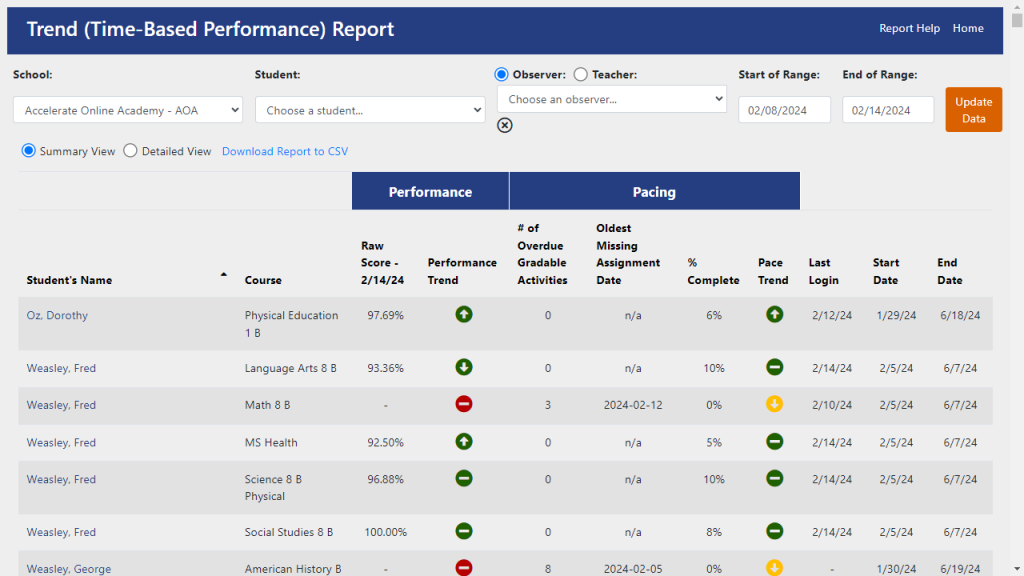
Summary View
The Summary View provides a snapshot of student performance and pacing by course.
Available Data
- Student Name (Hyperlink): Opens a real-time snapshot of the student’s performance, including course grade
- Raw Score: The grade displayed in Buzz
- Performance Trend:
- Color indicators:
- Green: Above 70%
- Yellow: 60–70%
- Red: Below 60%
- Arrows:
- Up: Improvement
- Down: Decline
- Dash: No change
- Question mark: Not enough data (early in term)
- Color indicators:
- # of Overdue Gradable Activities: Total number of past-due graded assignments
- Oldest Missing Assignment Date: Date of earliest missing assignment (or N/A if none)
- Percentage Complete: Based on graded activities only
- Pace Trend:
- Color indicators:
- Green: ≤15% overdue
- Yellow: 15–30% overdue
- Red: >30% overdue
- Arrows indicate change over time (up, down, dash, or question mark)
- Color indicators:
- Additional Fields: Last login, course start date, and end date
While the Summary View provides a snapshot at the end of the selected date range, the Detailed View offers deeper insight into changes over time.
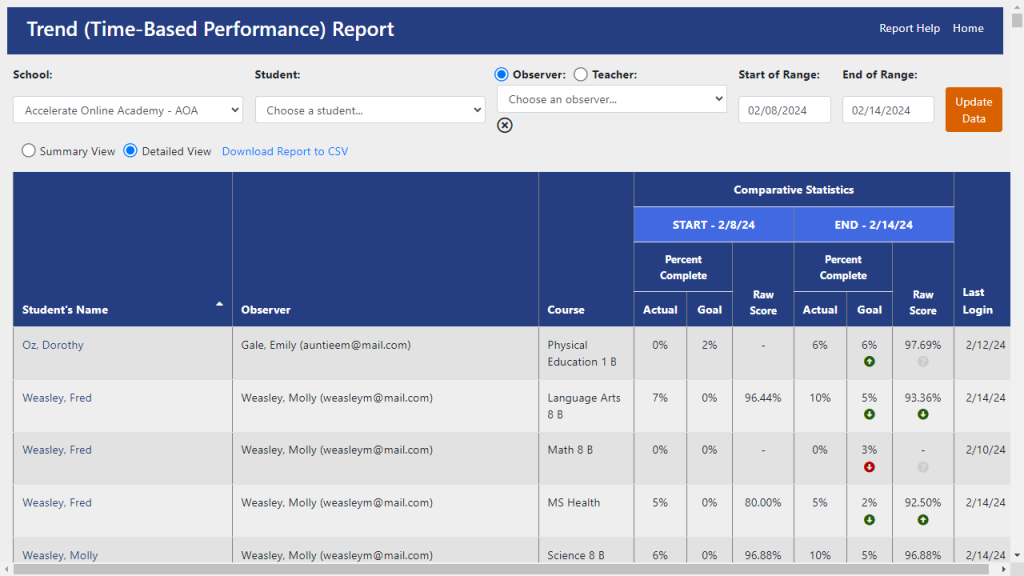
Detailed View
The Detailed View shows how student performance and pacing have changed between the selected start and end dates.
Key Metrics
- Percent Complete:
- Displays actual vs. goal completion for both start and end dates
- Includes icons indicating increase, decrease, or no change
- Raw Score:
- Displays grades at both start and end dates
- Includes icons showing performance trends (increase, decrease, or no change)